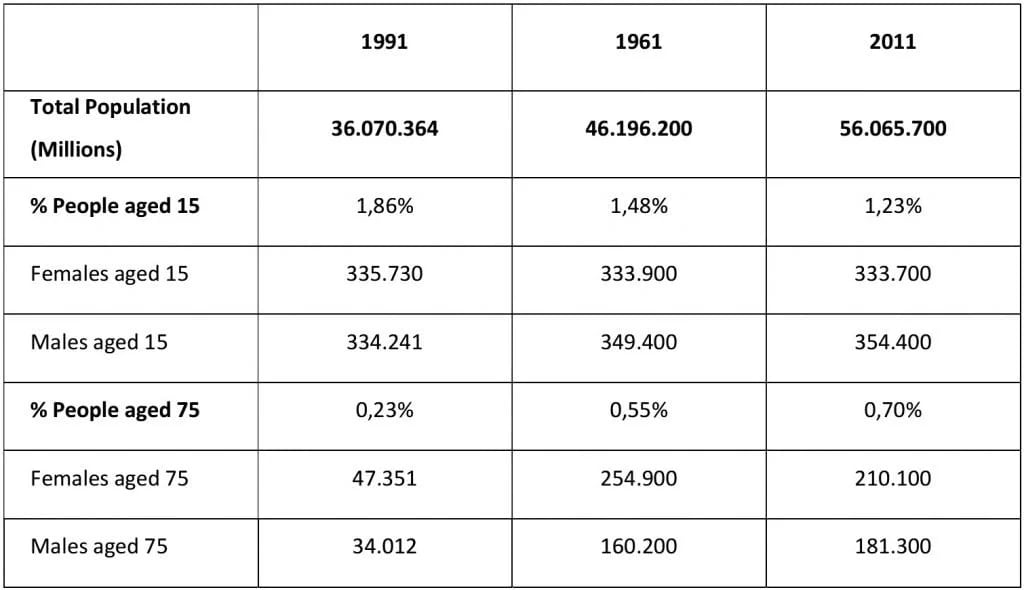
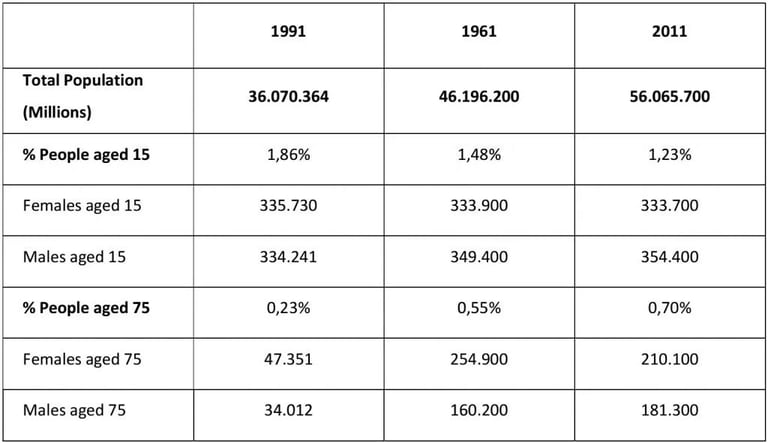
1. The table shows the proportion of female and male aged 15 and aged 75 from 1911 to 2001 in the UK.
Sample answer,
The given table graph depicts the information about the percentage of males and females at the age of 15 and 75 in the UK during the years 1911, 1961 and 2011.
Having a myopic look, it is clear that, Those aged 15, the number of females experienced an downward trend, beginning with 335,730 in 1911 and finishing with 333,700 in 2011. However, the opposite was seen for males, as the number of 15 year-olds increased from 334,241 in 1911 to 354,400 in 2011.
Furthermore, for those aged 75, the female population was significantly larger than the male, and there was a similar trend between the two genders. Starting at 47,351 females and 34,012 males in 1911, the figures for females surged to a peak of roughly 255,000 and 160,000 for males in 1961. Following this, the number of females aged 75 decreased to 210,100 people, while that of their male counterparts continued to rise to 181,300 in 2011.
Overall, there was a decrease in the proportion of people aged 15, whereas the figures for those aged 75 increased throughout the period. In addition, there were significantly more elderly women than men.
Contacts
megamindieltsinstitute@gmail.com
+91 98552-03014