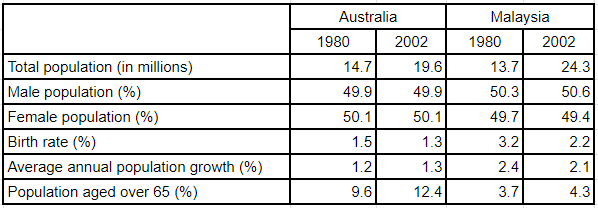
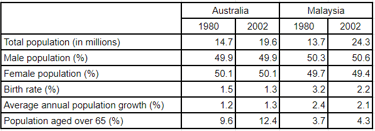
2. The table below gives information about population in Australia and Malaysia in 1980 and 2002.
Sample Answer,
The given table graph depicts the information about therange of demographic data from Australia and Malaysia in 1980 and 2002.
Having a myopic look, it is clear that,the gender ratios in both countries were almost perfectly balanced. There were slightly more women in Australia within 50.1% and slightly more men in Malaysia(50.6%) in both years respectively. Also, the difference in population between the two countries in 1980 was minimal, at only about 1 million. However, the difference was around 5 million in 2002, as the population of Malaysia almost doubled.
Furthermore,the two countries also differed widely in relation to the birth rate. The birth rate in Malaysia was almost twice as high as that of Australia (3.2% and 2.2% compared to 1.5% and 1.3%). As a result, average annual population growth in Malaysia was also higher. Another notable feature is that while the percentages of people aged over 65 in Malaysia were approximately 4% in both years, the figures for Australia were much higher, at 9.6% and 12.4% in 1980 and 2002, respectively.
Overall, Malaysia had a relatively younger population than Australia, and a remarkably faster
population growth.
Contacts
megamindieltsinstitute@gmail.com
+91 98552-03014