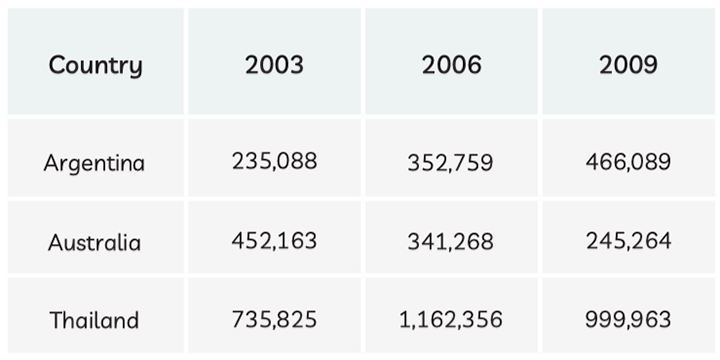
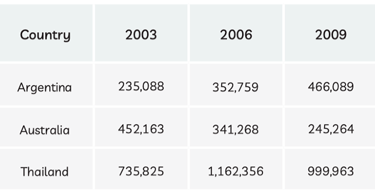
3. The table below shows the number of cars made in Argentina, Australia and Thailand from 2003 to 2009.
Sample Answer,
The given table graph depicts the information about the car production in three different countries over a period of 6 years, starting from 2003.
Having a myopic look, it is clear that, In 2003, 735,852 cars were produced in Thailand, significantly more than in the Australia, with just over 450,000 cars. The figure for Argentina, however, was only about a third of the figure for Thailand and half that of Australia, at 235,088. Over the following six years, Thailand still remained first rank in car manufacturing among the three countries. Their car production soared to 1,162,356 cars in 2006 before dropping back down to approximately one million 2009.
Furthermore, the number of cars manufactured in Argentina increased throughout the period to 466,089 cars, which made them become the second biggest manufacturer of cars in the last year. Moving further, the figure for Australia, however, experienced a downward trend over the period, decreasing to just under 250,000 cars by the end of the period.
Overall, Thailand produced the largest number of cars over the period shown. While the least number of cars manufactured in Australia.
--------------------------------------------------------
Contacts
megamindieltsinstitute@gmail.com
+91 98552-03014