4. The charts below give information on the ages of people when they got married in one particular country in 1996 and 2008.
Sample answer
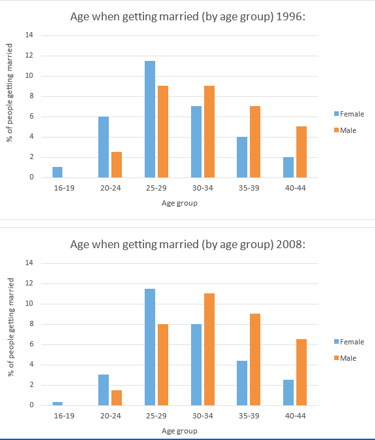
The given bar graph depicts the information about the percentage of males and females, in a particular country, getting married according to six different age groups (16-19, 20-24, 25-29, 30-34, 35-39, 40-44), in 1996 and 2008.
Having a myopic look, it is clear that, In both years, 16-19 year olds were the lowest percentage of people getting married, with women at less than 0.5% in 1996 and about 1% in 2008. Noticeably, no men in the 16-19 age group got married. The figures for those aged 20-24 also reduced over the years from approximately 6% to 3% for women and just over 2% to just under 2% for men respectively. Meanwhile, the figure for 25–29-year-old women remained unchanged at about 12%, as opposed to a slight drop to 8% in the figure for men.
Furthermore, regarding older age groups, a considerable rise to 8% and 11% respectively could be seen in the proportion of 30–34-year-old females and males getting married. However, while the number of men who got married aged 35-39 increased by 4%, to 11% in 2008, only 3% of women in that age group married in 2008. Finally, the figures for both genders in the 40-45 age group remained relatively unchanged over the examined period.
Overall, 25-29 was the most popular age range for women to get married, while for men it was 30-34 and 35-39.
____________________________________________________

Contacts
megamindieltsinstitute@gmail.com
+91 98552-03014