Bar Graph
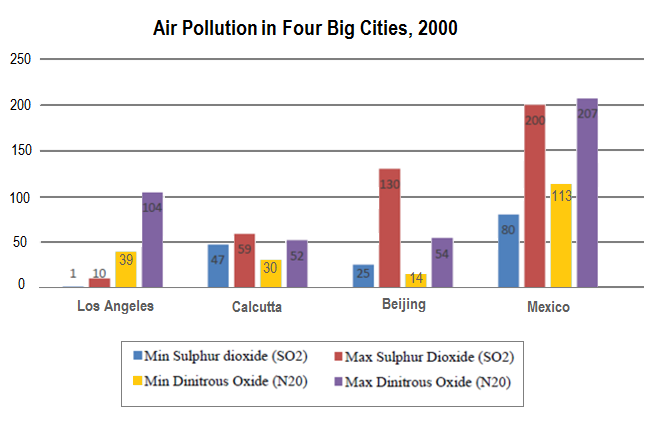
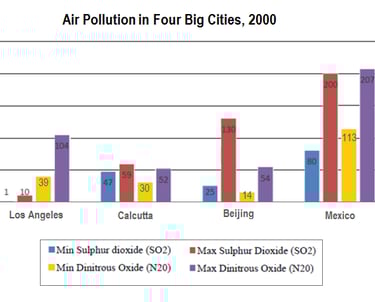
The chart below shows the average daily minimum and maximum levels of two air pollutants in four big cities in 2000.
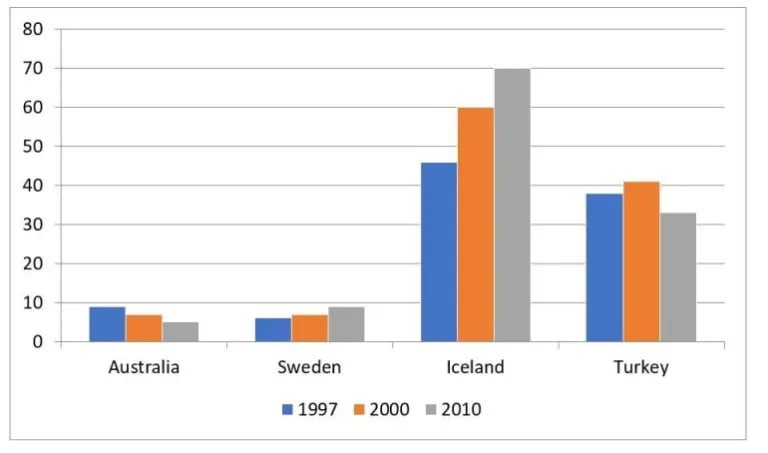
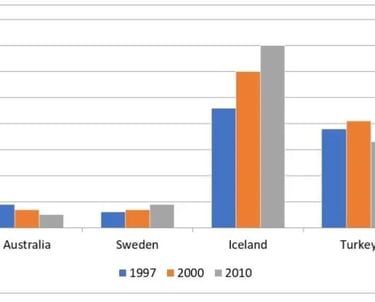
The chart shows the proportion of renewable energy in total in total energy supply in four countries from 1997 to 2000.
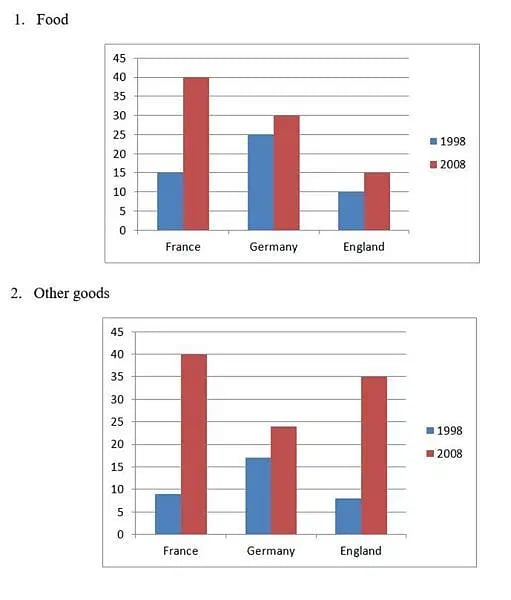
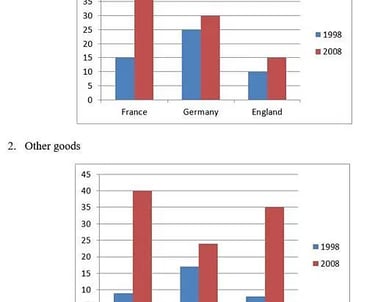
The percentage of money spent on food and other goods by people of three countries France, Germany, England in 1998 and 2008.
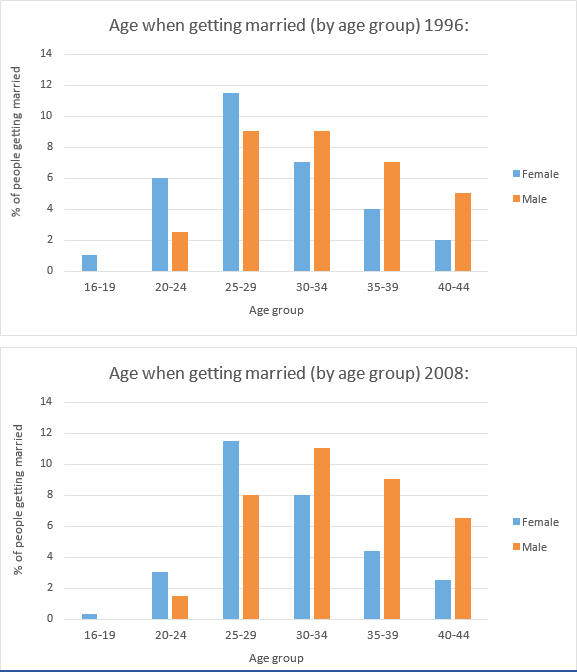
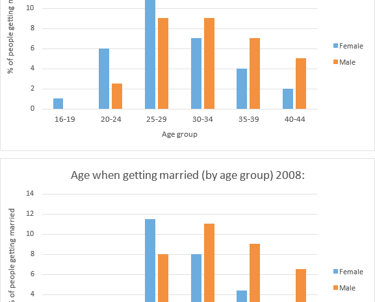
The charts below give information on the ages of people when they got married in one particular country in 1996 and 2008.
Contacts
megamindieltsinstitute@gmail.com
+91 98552-03014